The latest reading on monthly inflation came in hot once again on Wednesday. Predictably and understandably, both stocks and bonds did not like the news. While concerns about the latest CPI report may be overdone, some broader market signals may be suggesting that the longer trend of easing inflationary pressures may be at increasing risk.
Hot, hot, hot . . . It has been a recurring theme throughout 2024. Economic data is released – GDP, jobs, inflation – and it comes in hotter than expected. The latest was the release of the Consumer Price Index from the U.S. Bureau of Labor Statistics, which – wait for it – came in hotter than expected.

Now we could get into the weeds to debate why this week’s CPI report may or may not be as persistently hot as it might look at first glance (this Chief Market Strategist is on the “may not” side), but it’s worthwhile to stick to the bigger picture.
The latest CPI reading has tripped some warning signs that warrant closer attention in the months ahead. Put simply, we can withstand hotter than expected inflation readings as long as the year over year trend in headline and core inflation remains lower. And this had been generally true to a diminishing extent up through last month. But with this latest reading for March, we could be seeing what may end up being the very beginning of a reversal in trend.
Headline inflation had bottomed at 3.05% nearly a year ago now, but had been holding steady in the 3.10% to 3.30% range since last fall. But the latest reading for March sent the headline inflation rate up toward 3.5% and its highest reading since last September. Moreover, the trend for the year on headline annual CPI inflation is starting to bend higher. It’s still early on this recent development, but one that warrants close attention as we move through the spring and into the summer.
A source of reassurance amid the steady stream of hotter inflation data was the fact that the core inflation continued to trend lower, albeit at a diminishing rate. But with the latest release for March, we saw the annual change in the Core CPI tick higher by 4 basis points from 3.76% to 3.80%. This marks the first rise in the annual Core inflation rate since March 2023. Now it’s important to emphasize that a single data point certainly does not make a trend, particularly when we’re only talking about 4 basis points. But we will want to monitor to see if this number turns back lower when the April data is released next month just as it did previously in April 2023.
Checking the heat. As would be anticipated following the latest hot CPI inflation reading, expectations around interest rate cuts from the Federal Reserve took another hit. After hitting a peak of as many as seven quarter point rate cuts from the Fed coming into the year, we have now shrunk to expectations for only two cuts by the end of 2024. Now this Chief Market Strategist has held the view for some time that we may not see any rate cuts from the Fed this year, and this arguably would not be a bad thing. Nonetheless, it is important as investors to keep our eyes on the right heat settings.
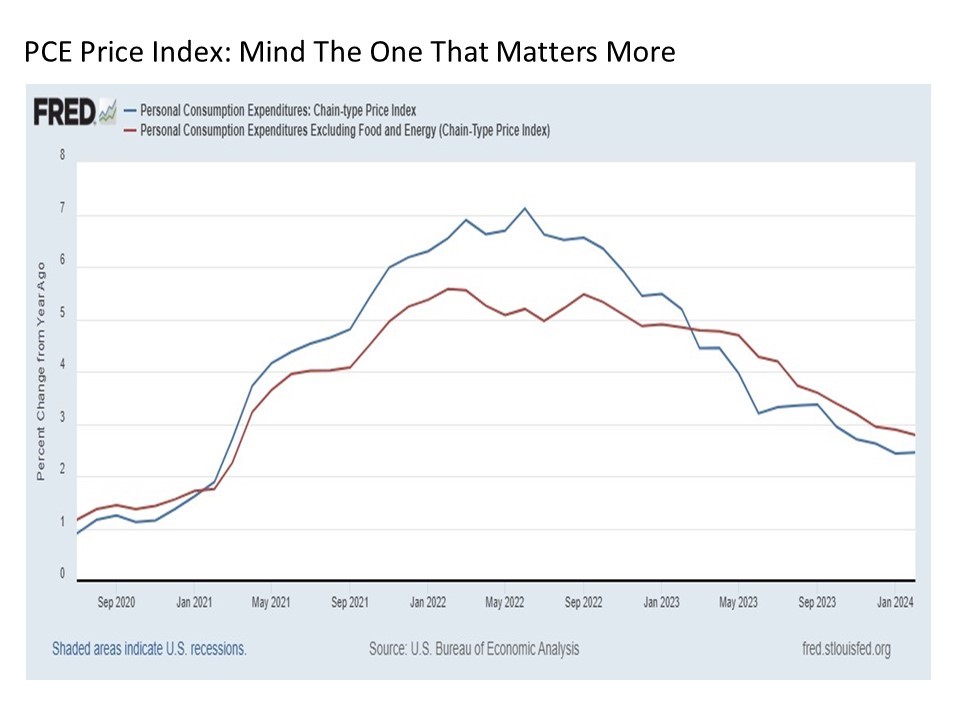
While the CPI inflation data may have come in hot, this is not the inflation reading monitored by the Fed when making their monetary policy decisions. Instead, it is the Personal Consumption Expenditures (PCE) price indices. And unlike the flatting CPI readings, the PCE data continues to trend more definitively lower.

As a result, a key date to mark on your calendars is April 26 when we get the latest PCE inflation readings for March from the Bureau of Economic Analysis. This will give us much more direct insight into whether the Fed may still follow through on the rate cuts that so many market participants are still anticipating.
Warning signs. A number of other readings are also worth monitoring in the days and weeks ahead in seeking to determine the future direction of inflation. Commodities such as oil, copper, and gold, all of which are higher in price by double-digits year to date are natural places to start.
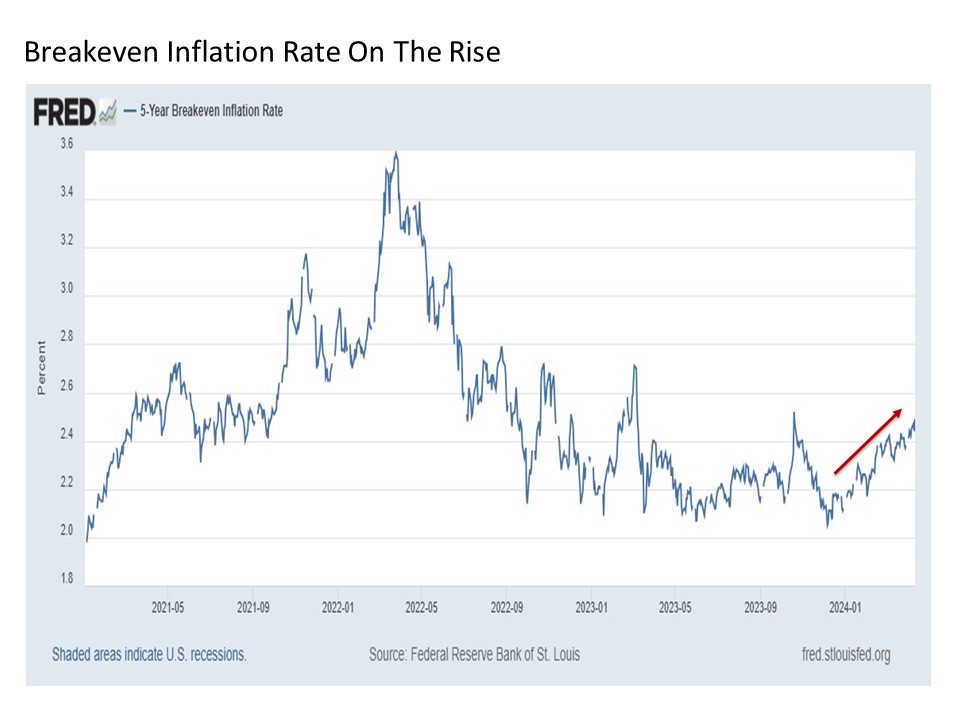
Another reading from the economic realm worth monitoring is the breakeven inflation rate, which is a measure of expected inflation derived from nominal Treasuries and their comparably dated inflation-indexed counterpart. More simply, it provides a reading of what the market expects inflation to be over the next five years on average.

In a development worth watching going forward, the 5-year breakeven inflation rate has risen by 0.43 percentage points from its early December lows at 2.05% to 2.49% today. This reading climbed as high as 2.52% last October before retreating lower, and one gets the feeling that we may break out above this most recent high in the weeks ahead. An expected inflation reading in the 2.5% is still constructive, but something approaching the 3% level or higher may strike the market (and the Fed) quite differently.
Bottom line. The trend of easing inflationary pressures dating back to 2022 is coming increasingly under pressure. Markets have been resilient so far, but as each new economic reading comes in hotter than expected, it remains important to continue to monitor inflation readings closely for any potential changes in trend. If inflationary pressures start to sustainably rise, risk assets may ultimately start to wilt.
Disclosure: I/we have no stock, option or similar derivative position in any of the companies mentioned, and no plans to initiate any such positions within the next 72 hours. I wrote this article myself, and it expresses my own opinions. I am not receiving compensation for it. I have no business relationship with any company whose stock is mentioned in this article. Investment advice offered through Great Valley Advisor Group (GVA), a Registered Investment Advisor. I am solely an investment advisor representative of Great Valley Advisor Group, and not affiliated with LPL Financial. Any opinions or views expressed by me are not those of LPL Financial. This is not intended to be used as tax or legal advice. All performance referenced is historical and is no guarantee of future results. All indices are unmanaged and may not be invested into directly. Please consult a tax or legal professional for specific information and advice.
Compliance Tracking #: 565491-1
