James Bond: “I admire your courage, Miss…?”
Sylvia Trench: “Trench, Sylvia Trench. I admire your luck, Mr…?”
James Bond: “Bond. James Bond.”
–Dr. No, 1962

SPECTRE. The U.S. stock market is a relentless winner. For nearly two decades since the financial crisis, stocks have been repeatedly confronted with all measures of danger and tight spots seemingly impossible to escape. Whether facing down the PIIGS, an oil market collapse, a global contagion, a scorching inflation outbreak, or averting another implosion of the global banking system, the U.S. stock market through luck and pluck has shown the ability time and time again to diffuse the proverbial bomb with a cheeky 0:07 seconds left on the clock to save the day for the investment world. But just as James Bond has faced down his and the world’s villains 25 times (or is it 27? or 28?) in the past and is set to give it a go once again with Amazon MGM in around late 2027 or 2028, so too is the U.S. stock market heading toward facing down it’s latest threat. But this time, the specter of danger this time coming from the most formidable of foes – it’s long-term ally and partner in the global bond market.
Dr. No: “The Americans are fools. I offered my services; they refused. So did the East. Now they can both pay for their mistake.”
–Dr. No, 1962
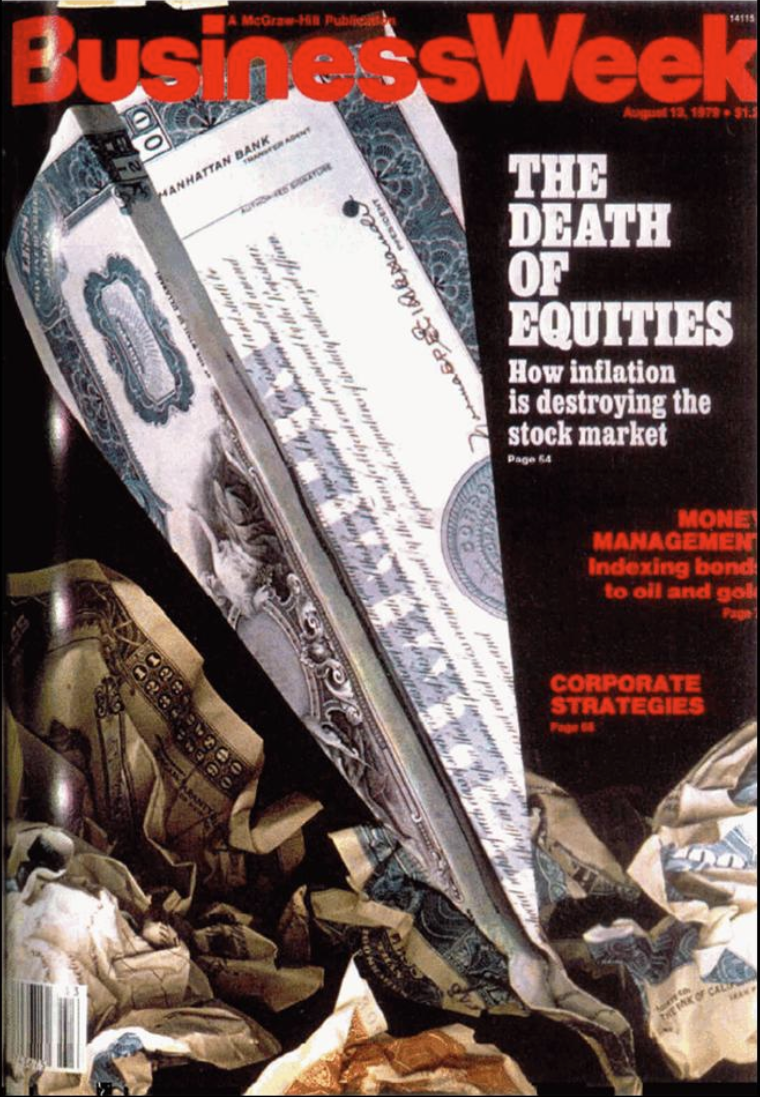
Resurfacing threat. U.S., nay global investors, have benefited from a steady and strong tailwind for many of our lifetimes. Emerging from the Live And Let Die era from the late 1960s to the early 1980s when a intermittent but prolonged bout of hyperinflation brought the global economy to its knees and induced BusinessWeek (then the largest magazine by advertising pages in the U.S) to declare “The Death of Equities”, U.S. government bond yields reached a stunning Piz Gloria peak of over 15% in September 1981. Take a moment to pause and reflect on this point for a moment – imagine today getting paid over 15% to lend money backed by the full faith and credit of the U.S. government. At 3% annual inflation, this is unbelievable (goodbye TINA, hello TARA and CINDY!). Alas, if the annual inflation rate is also around 15%, not so much, as CINDY is not enough, and stocks needed a P/E ratio south of 7 times earnings to provide a positive equity risk premium (that’s some Goldfinger laser style threat for investors at the time – death indeed).

But since 1981, the inflation threat increasingly subsided and the bond market entered into a four-decade bull market from 1981 to 2021. As bond yields fell from over 15% to less than 1%, bond prices rose (winning for the “40” in the standard “60/40” allocation) and stock valuations ballooned as falling yields enabled investors to justify paying ever increasing multiples for company shares through a still positive equity risk premium (the excess return that stock investing provides over the risk-free rate (Treasuries) (even bigger winning for the “60” in the “60/40”). It has been a win-win environment for investors for four decades.
Commercial break: Want a quick and dirty way to calculate the equity risk premium for stocks (not textbook, mind you, but “back of the napkin”)? Take the P/E ratio on the U.S. stock market (26.74 times trailing 12-month operating earnings on the S&P 500 today) and invert it to create a percentage (1/26.74 * 100% = 3.74% – this is the earnings yield, or the earnings investors are generating for each dollar of share price). Now compare this to the 10-Year U.S. Treasury yield (currently 4.08%: 3.74% – 4.08% = -0.34%). Translation: stock investors are not only NOT receiving a premium for taking on the added risk of owning stocks versus U.S. government bonds, they are paying -0.34% for the added risk to own stocks. What justifies this seemingly irrational behavior? The belief that companies will grow earnings in the future sufficiently to provide a positive premium in the future, which is why the market gets worked up about the prospects of an economic recession (negative growth) and wants those Fed interest rate cuts sooooo badly (goose growth while lowering the risk-free rate bar). Be careful what you wish for with Fed interest rate cuts, says the investor reflecting back on the period from September 2024 to January 2025 when the Fed cut rates by 1.0 percentage point yet the 10-year U.S. Treasury yield rose by more than 1.2 percentage points. Why? The specter of inflation that comes with those rate cuts. Enter Joseph Heller’s Catch-22 into the narrative (“eat your heart out Ian Fleming”), but I digress. Now back to our regularly scheduled article.
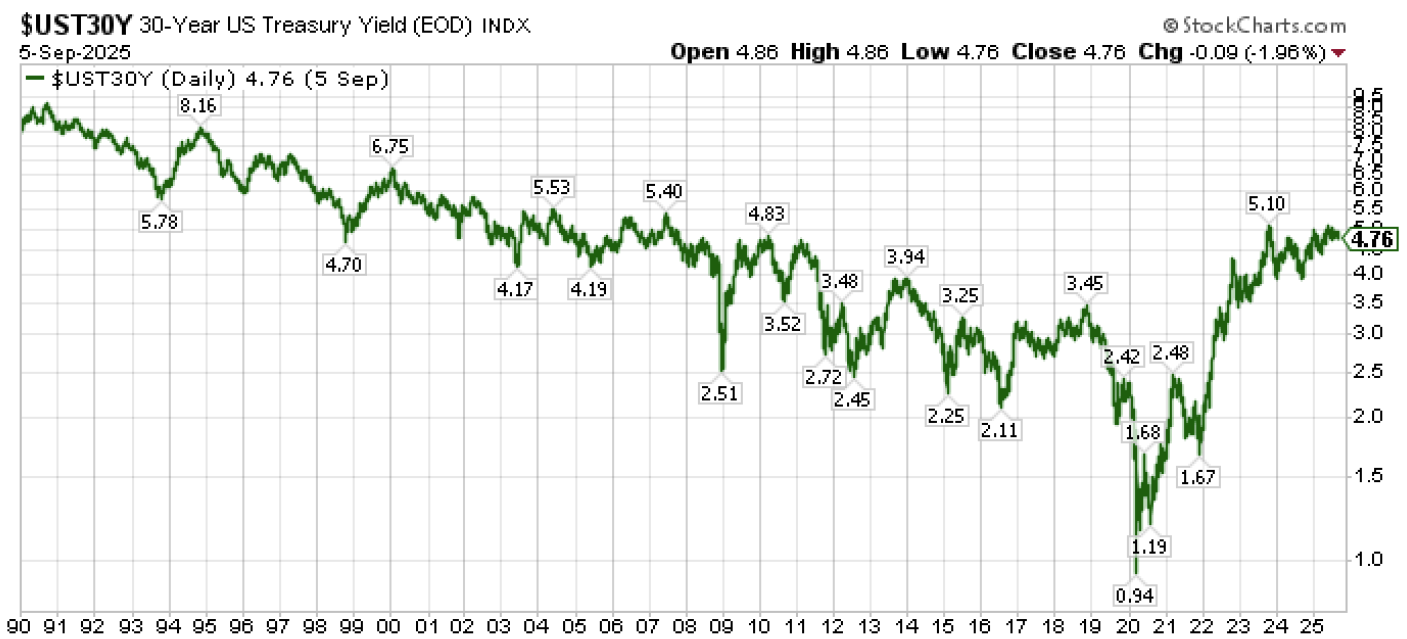
With all of this in mind, let’s introduce the chart below. Here is a chart of the 30-Year U.S. Treasury yield. As mentioned above, we mentioned the four-decade bond bull market that extended through 2021. But what has happened since 2021? It was actually 2020 when we saw the official lows in government yields below 1%. But bond yields remained low all the way through 2021. It wasn’t until the calendar flipped to 2022 and when the Russians started rolling tanks into Ukraine that Treasury yields started rising in earnest. And since that time, they keep rising. And rising.

So where are we today. The 30-Year U.S. Treasury yield, which reached a low of 0.94% a few years ago, is now at 4.76% and rising. It’s lurched over 5% twice over the last two years, and the trend in this long bond yield is definitively higher.
Let’s take this one step further. The U.S. makes up 39% of the total global bond market, but it is not alone in seeing this sharply rising trend in long bond yields. Consider Japan, France, the UK, Canada, Germany, and Italy, which together make up another 22% of the global bond market for a grand total of 61%. Each had 30-year government bond yields significantly less than 1% in recent years. Here is where these yields are today:
3.29% Japan
4.33% France
5.48% United Kingdom
3.69% Canada
3.27% Germany
3.50% Italy

Villain monologue. So, what does all of this mean for a U.S. stock market that remains seemingly oblivious to the latest threat growing all around it in the global long bond market.
Higher borrowing costs: The U.S. government is facing higher costs to borrow money to support future growth and spending initiatives. And if the U.S. government is paying more, corporations that rely on low cost borrowing to sustain growth are also likely to get squeezed. And if governments and corporations are paying more in interest to borrow money, they have less left over to spend.
Debt sustainability risks: It wasn’t that long ago that sovereign debt as percentage of GDP moved north of 60% and people were freaking out about it (it was 30% back in 1981 btw). Today we are at a 120% debt-to-GDP ratio, yet finding a politician in Washington interested in raising taxes and/or cutting spending is harder than finding Crab Key.
Specter of inflation: Higher long-term bond yields also send an important signal about potential inflation. If governments continue to spend, and if central banks are compelled or induced to lower interest rates and/or keep interest rates low, we could have a nasty inflation outbreak that may persist with damaging consequences. Just as we saw during the period from the late 1960s to the early 1980s when the economy was left to run too hot and monetary policy was left too easy (once again, this was during a time when the U.S. debt-to-GDP ratio was less than 40%. Today it is at 120%), we had an increasingly scorching inflation problem despite the fact that economic growth was sluggish and riddled with recessions.
Tighter liquidity conditions: Higher yields lead to slower growth, higher costs of capital, and higher discount rates for future cash flows (remember when you could plug 0% into your DCF to justify P/E ratios of infinity? This is becoming an increasingly distant memory.), all of which imply lower stock valuations than the frothy 27 times multiples in today’s marketplace (P/E ratios fell below 7 times back in 1981). Moreover, if bond yields keep rising and/or inflation starts to spiral out of control, fiscal and monetary policy makers may ultimately be compelled to cut spending, increase taxes, and/or raise interest rates. Put simply, the first ten months of 2022 could ultimately be a sneak preview of what might come to pass if the forces of steadily rising long term bond yields and rising inflation fully take hold.
Commercial break: Let’s get the napkins out again. Let’s be light and exclude the 1970s. Instead let’s focus on the post Living Daylights era since the stock market crash of 1987 when all of the original Fleming books had been made into movies and the Greenspan Fed first embraced the heroic role of repeatedly trying to save the stock market world. During the period from 1987 to 2007 when long bond yields were more comparable to where they are today, the average P/E ratio was 19.34 times earnings. With the S&P 500 currently at an annualized $242.50 per share on a trailing 12-month operating earnings basis, this implies a fair value price on the S&P 500 of 4688 today, all else equal. But as the James Bond movies repeatedly showed through its cinematic history, all else is never equal. Back to our regularly scheduled article.
Monomyth. There is a reason why investors hold the arguably misguided belief that the stock market does nothing other than go up over time. And there is a reason why we have 25 to 28 James Bond movies with another one on the way. This is because our literary hero always overcomes adversity, no matter how seemingly insurmountable, and saves the world at the end of the day. And the next episode to stagger global capital markets will be no different. It’s not a question of if. Instead, it is a question of whether you are ready when any such future episode comes to pass, whether it is the risk scenario outlined above or something entirely different and unexpected. And when such an episode finally erupts, what are you doing to not only defend against the collateral damage but also capitalize on the dislocations. Did equities die in the early 1980s as BusinessWeek forewarned? Indeed not, as it instead marked the beginning of the next great era of prosperity (not without some massive fits along the way!).
Let’s reflect back to that period from the late 1960s through the early 1980s that most closely rhymes with the risk episode outlined above. While BusinessWeekwas contemplating the “Death of Equities”, investors were absolutely crushing it in energy and materials stocks. Consider the following list of publicly traded companies that were all in the top ten in the U.S. by market cap at the time: Exxon, Mobil (once separate companies, now ExxonMobil), Texaco (now part of Chevron), Standard Oil of California (Chevron), Standard Oil of Indiana (Amaco now part of BP), Atlantic Richfield (ARCO now part of BP), Shell, Schlumberger, and DuPont. A different kind of Mag 7 line up for a different time. Then there was commodities including the precious metals of gold and silver, the latter of which hit $50 per ounce in 1980 that is 20% above where it is trading today a half century later.
What else did well during this past period? Here’s two: 1) Value meaningfully outperformed growth and 2) International meaningfully outperformed U.S. Does anyone see potential opportunities in these relative value trades circa September 2025 even without the above risk scenario playing itself out (imagine a James Bond movie where he’s only just plays golf with Auric Goldfinger and then goes home to doom scroll through his phone (where does James Bond live anyway? what kind of rates is he paying for life insurance, particularly given all those years that he smoked? what is his investment time horizon? does he think NVIDIA is overvalued? – nah, let’s get back to the saving the world theme, much more interesting – besides, we need a change catalyst, am I right?)).

Let’s go one more as we progress our way through the triumph toward the denouement. Consider the now nonagenarian investor Warren Buffett, who as a quadragenarian investor fifty years ago was establishing the foundation of his fortune by hoovering up deeply discounted small and mid-cap value companies throughout the decade of the 1970s when equities were supposedly dying.
Bottom line. Downside risks are accumulating for the U.S. stock market, and a leading risk is building in the long bond not only in the U.S. but around the world. How this risk plays out remains to be seen, but even if the worst comes to pass, remember that with dislocation comes opportunity. Maybe today’s Mag 7 won’t be so Mag anymore, but capital currently concentrated in a small handful of growth stocks has a lot of attractive destinations to flow both within equity markets and across capital markets. There is a reason why the 1970s is often regarded as the greatest period for active management, and such periods are often even greater for financial advice, as we are all reminded once again that there’s more to achieving your long-term goals than simply chasing the latest stock market winners.
Disclosure: I/we have no stock, option or similar derivative position in any of the companies mentioned, and no plans to initiate any such positions within the next 72 hours. I wrote this article myself, and it expresses my own opinions. I am not receiving compensation for it. I have no business relationship with any company whose stock is mentioned in this article.
Investment advice offered through Great Valley Advisor Group (GVA), a Registered Investment Advisor. I am solely an investment advisor representative of Great Valley Advisor Group, and not affiliated with LPL Financial. Any opinions or views expressed by me are not those of LPL Financial. This is not intended to be used as tax or legal advice. All performance referenced is historical and is no guarantee of future results. All indices are unmanaged and may not be invested into directly. Please consult a tax or legal professional for specific information and advice.
LPL Compliance Tracking #: 794192
