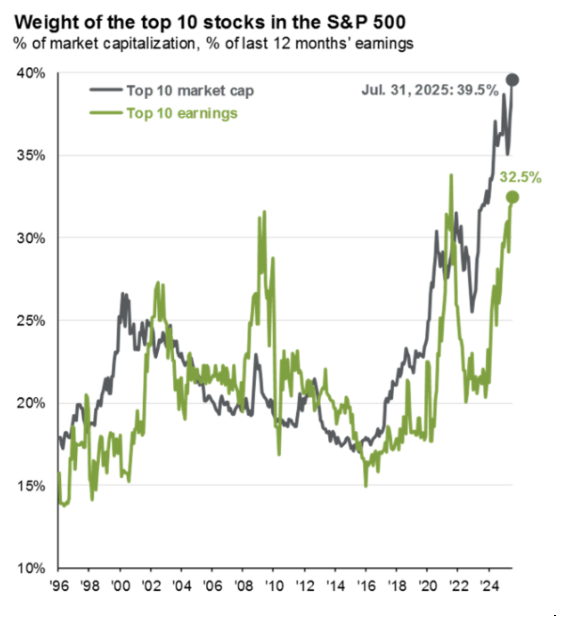
Heavy is the head that wears the crown. While equity markets have staged a powerful recovery since bottoming in April amid noise around international trade, much of Wall Street is beginning to question whether the rebound has gone too far. Market concentration has reached unprecedented levels: 10% of companies within equity markets now account for 76% of total market capitalization, an all-time high. Within the S&P 500, the top 10 names represent nearly 40% of the index. Since April’s lows, the 20 largest stocks have surged an average of 40.6%, collectively eclipsing the entire market capitalization of China. The statistics could be stacked endlessly, but the message is clear – equity leadership has grown exceptionally narrow, a pattern markets have seen before and one that has often left investors exposed when sentiment shifts.

Lessons From the Past
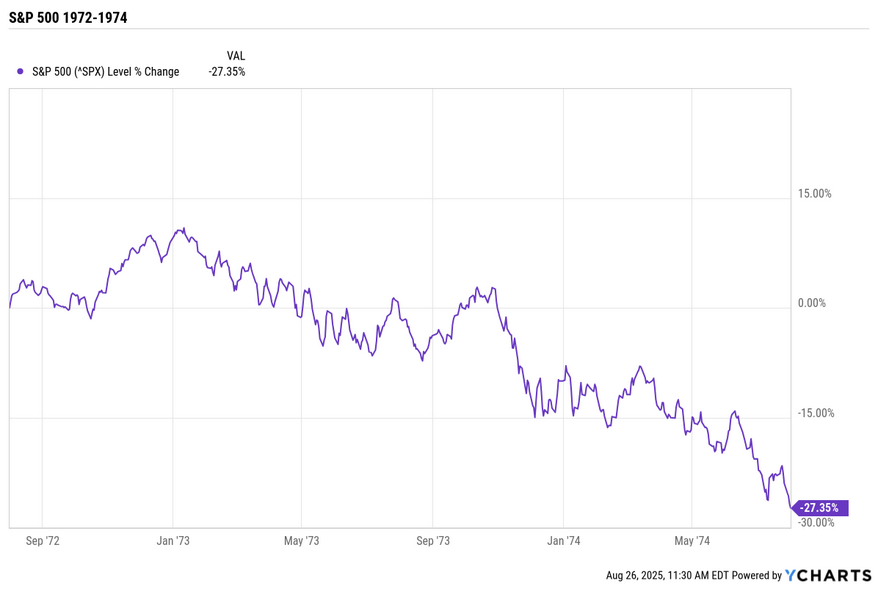
This is not the first era of extreme concentration. In the early 1970s, the so-called “Nifty Fifty” commanded investor attention, a group of blue-chip stocks considered untouchable. Dubbed “one-decision” stocks because they were believed to be permanent holdings, they propelled the bull market of the early 1970s. Unlike the dot-com leaders that came decades later, the Nifty Fifty were profitable businesses with real earnings power. From 1957 through 1972, they posted average earnings growth of about 11% per year. The flaw would prove not to be the businesses themselves, but in investor behavior: valuations were ignored and multiples stretched. At their peak, the group traded at 42 times earnings, more than double the S&P 500’s average of 19. During this time, the top five companies made up almost a quarter of the market. Sound familiar?
The breaking point came quickly. Inflation surged above 12%, interest rates spiked, and the U.S. economy slid into recession in 1973 and 1974. Subsequently, the Nifty Fifty’s darlings unraveled: Polaroid plunged 91%, Disney fell 87%, Avon dropped 86%, McDonald’s declined 72%, and even Coca-Cola lost roughly 69% from its peak.

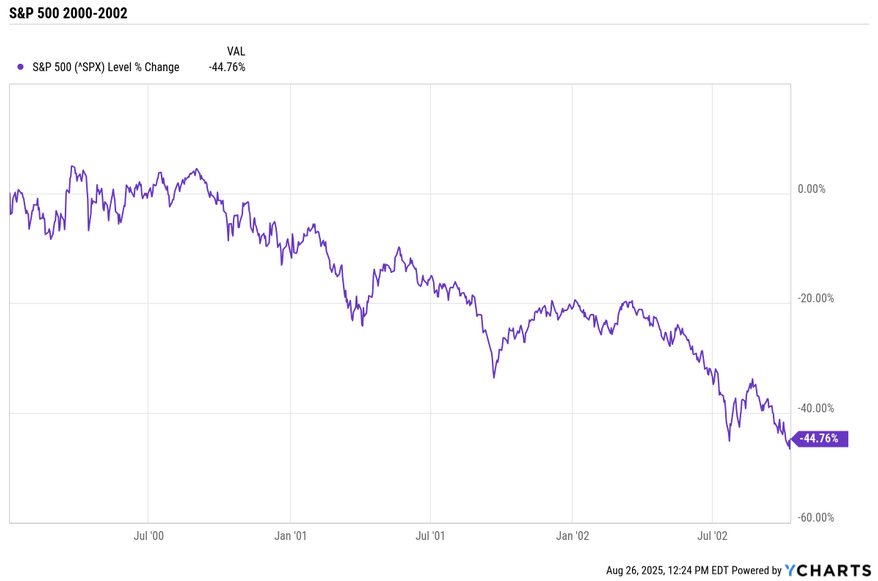
The cycle repeated at the turn of the millennium. Equity markets soared as the internet transformed business and drove speculation, culminating in the dot-com bubble. In 1999, the top 15 stocks accounted for roughly 70% of the S&P 500’s advance, and by March 2000, the five largest stocks represented nearly 18% of the index. When the bubble burst, the S&P 500 plunged almost 50% between 2000 and 2002, with the biggest winners of 1999 suffering the steepest losses.

While today’s backdrop differs with AI-driven demand built on tangible technological and productivity gains, many of the parallels to these past bear markets are challenging to ignore. Once again, a handful of giants are carrying markets to record highs. And history is consistent in its warning: when leadership narrows too far, markets become more fragile.
Recent Cracks
Even before history is invoked, current markets are flashing signals of strain. The “Magnificent Seven” – technology, communication services, and consumer discretionary giants – have been responsible for much of the S&P 500’s gains. Broadening the group to the “Ten Titans” which adds Netflix, Oracle, and Broadcom, leadership is still concentrated in just a handful of names.
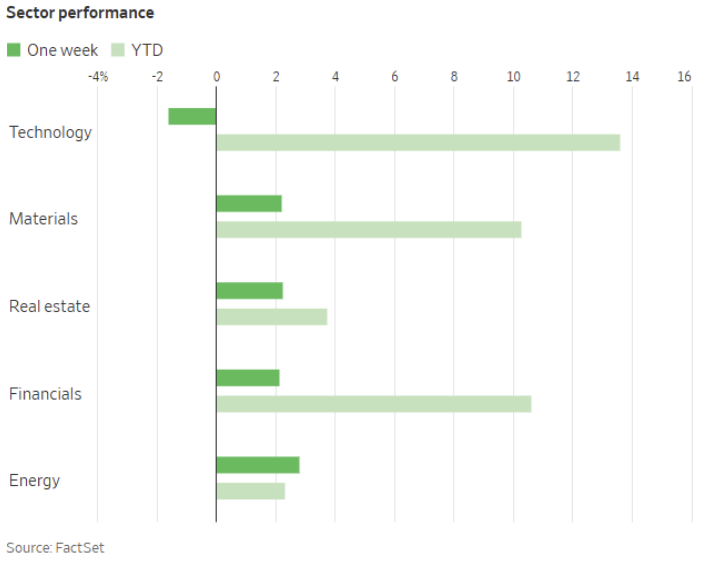
Signs of fatigue have already started to appear with technology stocks falling 1.6% during the August 18th trading week, despite a late rebound following Fed Chair Jerome Powell’s comment that a September rate cut was in the cards. According to JPMorgan, retail investors were net sellers during the steep decline on August 19th – the first such occurrence in two months. Economic data hasn’t helped sentiment either. Inflation remains sticky with key PCE reports coming out on Friday August 29th, while early August brought weak job openings data and major downward revisions to employment figures. Recent tech news piled on the bearish sentiment when a widely anticipated launch of OpenAI’s GPT-5, marketed as a “PhD-level expert”, disappointed investors and analysts alike, raising questions about the pace of innovation. It’s important to acknowledge seasonality also plays a role as late summer often brings heightened volatility amidst thinner trading volumes.

Scale of Concentration
Revisiting the beginning of this article, the current concentration at the top of the market is staggering. The S&P 500 has a market cap of approximately $54.3 trillion at the time of writing which accounts for about 80% of the overall U.S. stock market. For size, China’s stock market, which is the second largest in the world, has a market cap of around $14 trillion. This means that the 10 largest S&P 500 constituents are collectively worth almost twice as much as all of China’s publicly traded companies.
For investors that means diversification has eroded with the index. It also means that its market-cap weighted nature has supplied double digit returns in 2023 and 2024 and led it to dramatically outperform its equal weighted counterpart over the past decade. Nonetheless, downturns are sharper, deeper, and volatility sustains longer. This was evident during the bear markets of 2020 and 2022, underscoring the fragility of a narrow leadership group.
Looking Ahead
The immediate question is whether today’s leaders – Amazon, Alphabet, Apple, Meta Platforms, Microsoft, Tesla and Nvidia – can sustain their dominance. A near-term test comes this week, when Nvidia, now the world’s most valuable listed company, reports earnings on Wednesday, August 27th. The results will serve as both a barometer for AI-driven spending and a sentiment catalyst for broader equity markets.
Yet the bigger picture extends beyond any single earnings point. What matters is not just whether the Magnificent Seven or Ten Titans continue to grow, but whether the broader market can withstand a stumble from its heaviest hitters. Both the Nifty Fifty of the 1970s and the tech titans of 2000 show how quickly concentration can unravel when expectations outrun reality. While today’s market may not be fated to repeat those episodes, the lesson is clear. Heavy is the crown, not by its own weight, but because so few shoulders carry it.
Disclosure: I/we have no stock, option or similar derivative position in any of the companies mentioned, and no plans to initiate any such positions within the next 72 hours. I wrote this article myself, and it expresses my own opinions. I am not receiving compensation for it. I have no business relationship with any company whose stock is mentioned in this article.
Investment advice offered through Great Valley Advisor Group (GVA), a Registered Investment Advisor. I am solely an investment advisor representative of Great Valley Advisor Group, and not affiliated with LPL Financial. Any opinions or views expressed by me are not those of LPL Financial. This is not intended to be used as tax or legal advice. All performance referenced is historical and is no guarantee of future results. All indices are unmanaged and may not be invested into directly. Please consult a tax or legal professional for specific information and advice.
LPL Compliance Tracking #: 788596
