“I get this feeling I may know you, as a lover and a friend, but this voice keeps whispering in my other ear, tells me I may never see you again”
–Peaceful Easy Feeling, Eagles, 1972
A billion stars all around. It’s all so perfect. The U.S. economy continues to grow at a healthy pace, inflationary pressures remain firmly in check, corporate earnings growth is brimming, and the U.S. stock market continues to advance to fresh new all-time highs. And all of this is happening as the U.S. Federal Reserve is poised to deliver up to two quarter point interest rate cuts before the end of the year to only add to the sparkling market environment. What is there possibly not to love? While life is not theater, all the world is still indeed a stage and the U.S. stock market has historically been a most dramatic player. And much like Mad Men’s “Tomorrowland” and Downton Abbey’s “Cricket Episode” (Season 3, Episode 8), I am left with the lingering unease that maybe it all seems just a bit too perfect, thus potentially foreshadowing the inevitable difficulties that lies ahead.
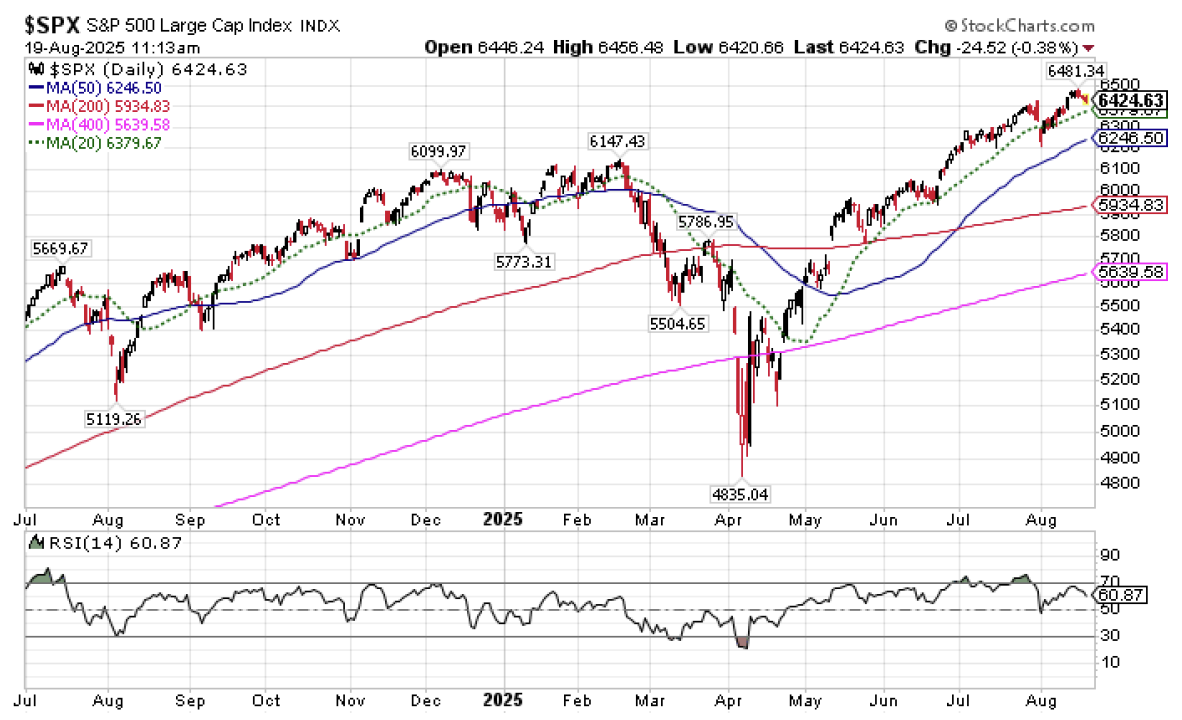
I know you won’t let me down. So what could possibly go wrong? Here’s what’s bugging me. Anecdotally, investor optimism is brimming, and for understandable reason. The widespread notion espoused by even the most experienced stock market experts is that the stock market “always goes up”. Thus, investors should take any downside volatility in stride and “buy the dip”, knowing that the market will eventually bounce back and reach new highs.
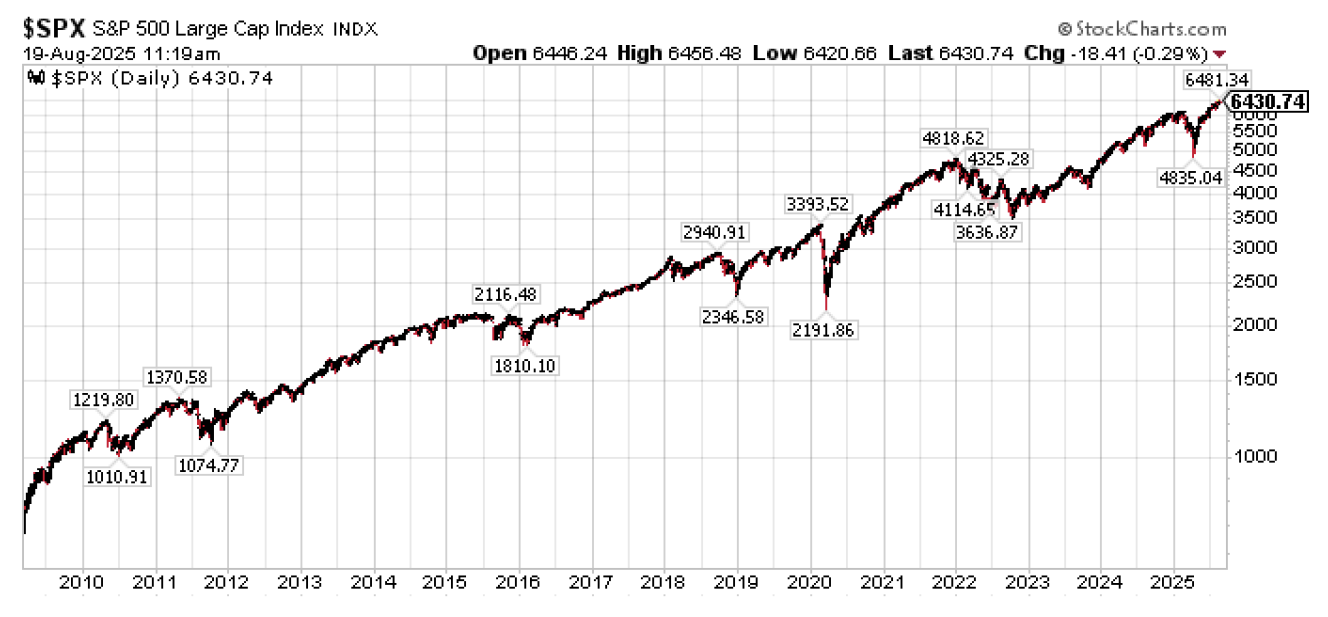
Need proof? I’ve got 16 years of proof, the experienced investor might say while slapping the chart below on the screen. Look at 2010, 2011, 2015, 2016, 2018, 2020, 2022, and earlier this year. All massive dips that took place along the way as the U.S. stock market grew by nearly ten times in price alone. And so it goes, “Stay the course no matter what, and you will be rewarded”. And for any market participant under the age of 40, this conclusion has been nothing other than spot on.
But here is the problem. It hasn’t always been this way. Let’s look at a most recent example, which is the 15-year period from 1998 to 2012 as shown below.
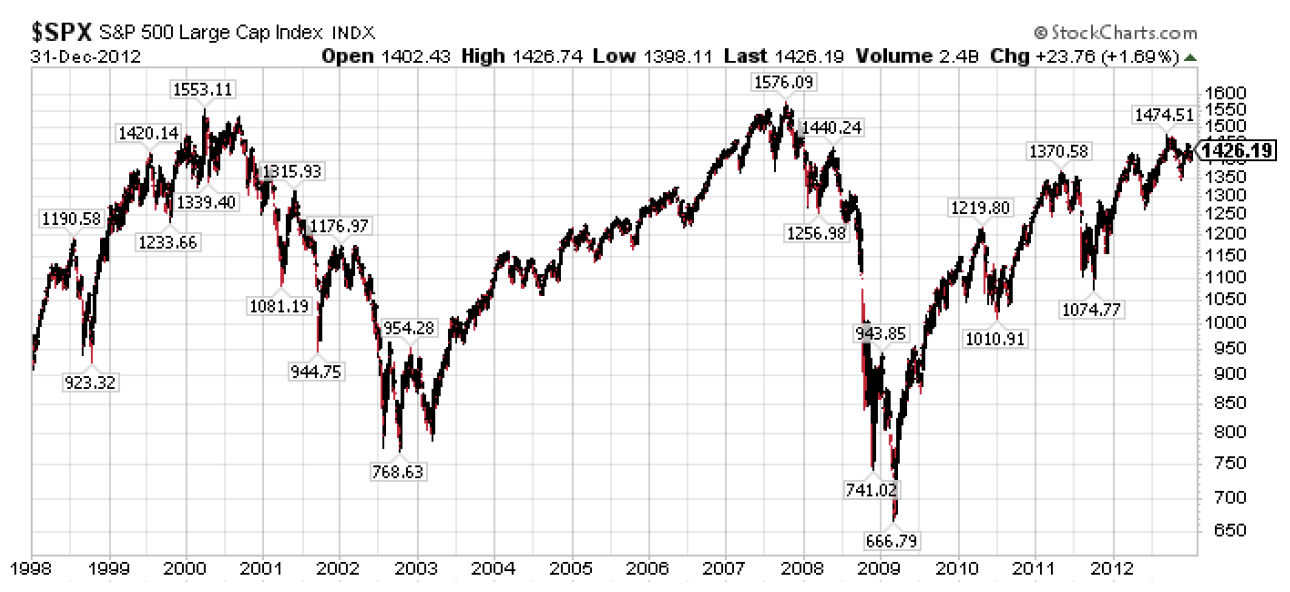
Here we have the opposite phenomenon. For extended stretches during this time period, the notion of “buy the dip” gave way to “sell the rips”. And if it wasn’t for a massive monetary policy intervention that rescued a failing hedge fund in Long-Term Capital Management followed with a massive monetary policy intervention in the wake of the bursting of the tech bubble that inflated a housing bubble that subsequently burst and nearly sucked the entire world down a black hole were it not for an even more massive monetary policy intervention to save the financial system, we would be looking at something vastly different than a sideways moving chart for 15 years. (You might be thinking “How many more massive monetary policy interventions might we need going forward?“. Yeah, me too. It’s one of the reasons my head kinda wants to explode a lil bit when I hear repeated calls for the Fed to cut rates just ’cause, you know, they can. I’m a big advocate of keeping some dry monetary powder unless you really need it, because even recent history lived by the 50+ crowd shows that times arise where you really need it).
So while 16 years from 2009 to the present seems like a really long time, it’s on the shorter side of what are known as secular market cycles, such as the 15 years prior from 1998 to 2012 that overlaps the current phase we are in today. What are these secular cycles? Basically, if you go back through really long periods of stock market history, you will repeatedly find that extended good periods for financial markets will be followed by extended more challenging periods that eventually fill the lessons in our economics and finance college courses for the next few decades (went to college in the 1990s and 2000s? You learned about the perils of “inflation”. Went to college in the 2010s through today? You learned about the financial crisis and the perils of “deflation” – always fighting yesterday’s battles we are).
With all of this in mind, we must not forget the following long accepted notions:
- “There is no present or future – only the past happening over and over again – now.” — Eugene O’Neill
- “History repeats itself, first as a tragedy, second as a farce.” — Karl Marx
- “Those who cannot remember the past are condemned to repeat it.” — George Santayana
- “History does not repeat itself, but it does rhyme.” — Mark Twain
- “Those that fail to learn from history are doomed to repeat it.” — Winston Churchill
It should be noted that the counterbalancing famous quotes about dismissing or blowing off history including sentiments like “History, Shmistory” are vastly far fewer and further between. This is for good reason.
Already know how to go. Still not entirely persuaded that the U.S. stock market entering into a more challenging period is a risk that we face going forward (which are periods that are absolutely great for active management and financial advisory work by the way, as it enables our profession to add true value for clients who need help navigating markets to achieve their long-term goals instead of trying to chase a small and changing handful of mega cap tech stocks irrationally to the upside)? Let’s take it from the top (or perhaps the early middle if you’re benchmarking all the way back to the Buttonwood Tree in 1792.
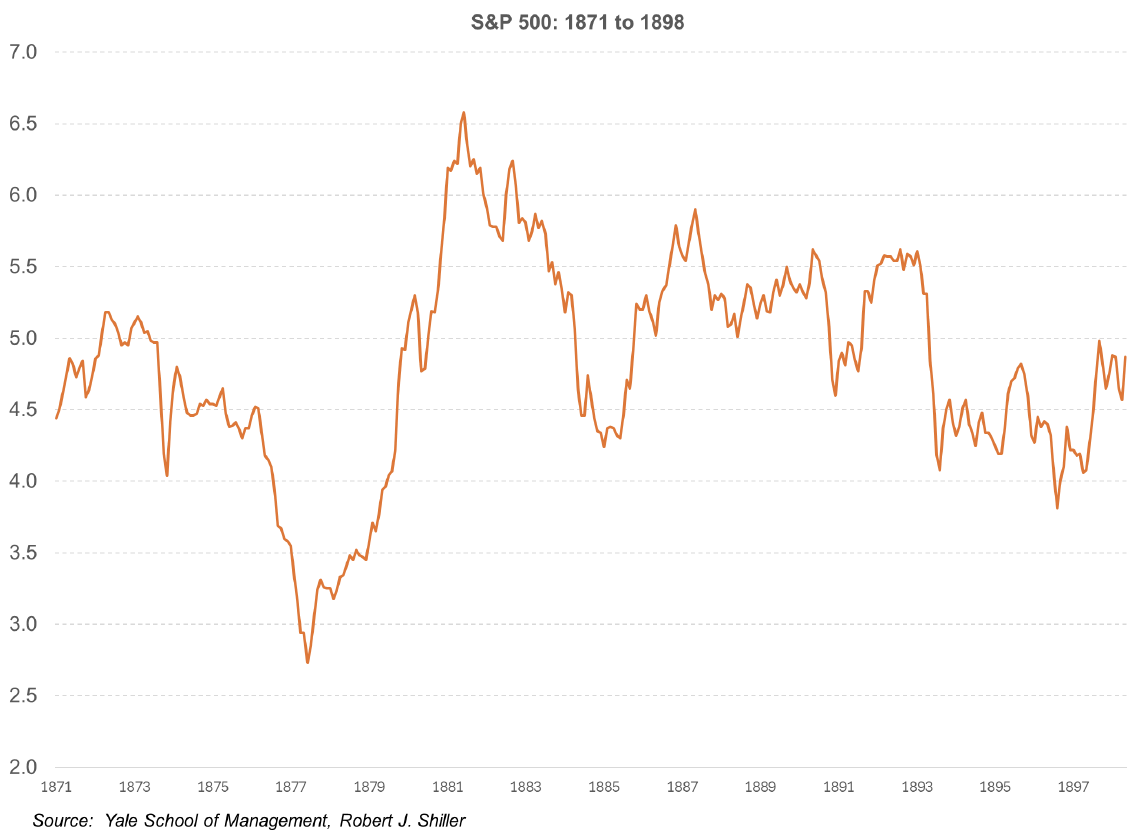
We’ll start with the period from 1871 to 1898, which is 28 years. We see a U.S. stock market that outside of a massive rip from 1877 to 1881 was adrift during the entire time period, ending up the century effectively the way it started nearly three decades earlier. This, much like the period from 1998 to 2012, is what would be referred to as a Secular Bear Market. These are prolonged periods where the stock market worked off the excesses accumulated during the previous bull market period.
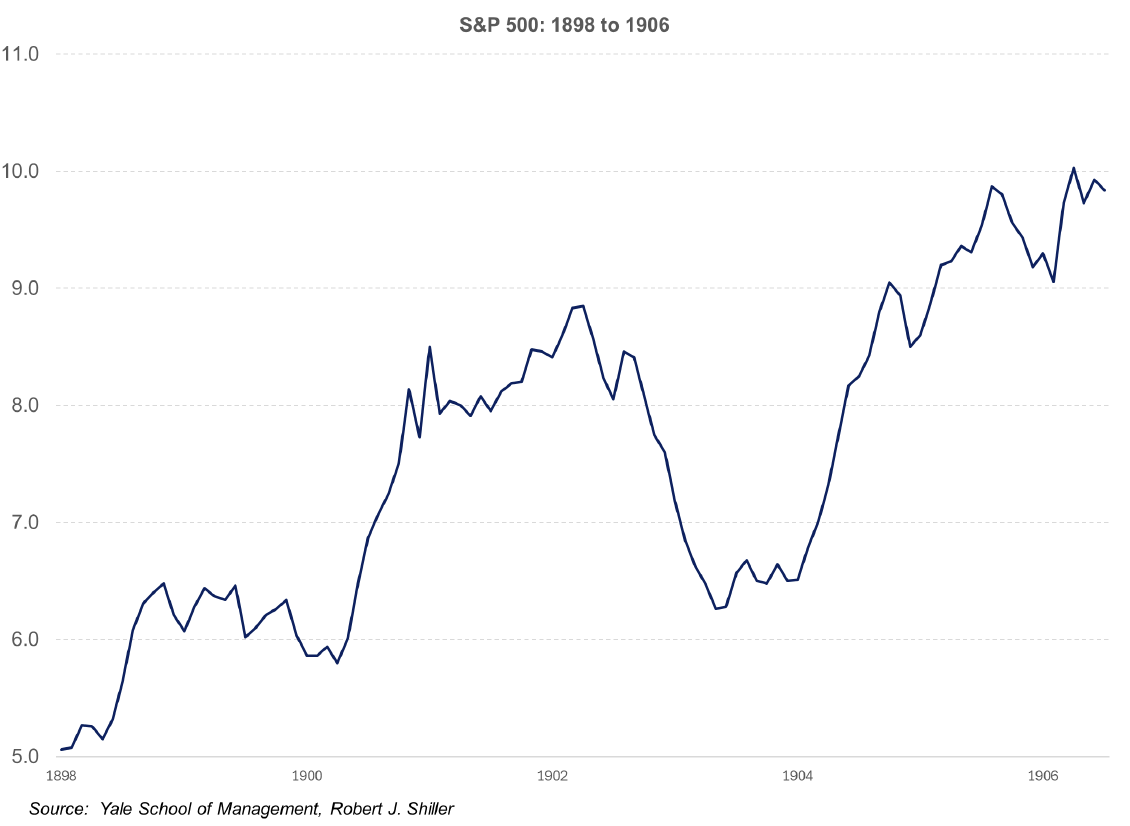
Let’s continue during a time when the bear reigned supreme and the bull was the afterthought. For the nine year period from 1898 to 1906, we saw the U.S. stock market double in value in a Secular Bull Market. What ended the strong run? The Panic of 1907 (reference the Great Financial Crisis from 2007-2009 for correlation – history rhyming exactly a century later), which led not only to a required period of working off accumulated excesses as described above but also led to the creation of the U.S. Federal Reserve six years later in 1913.
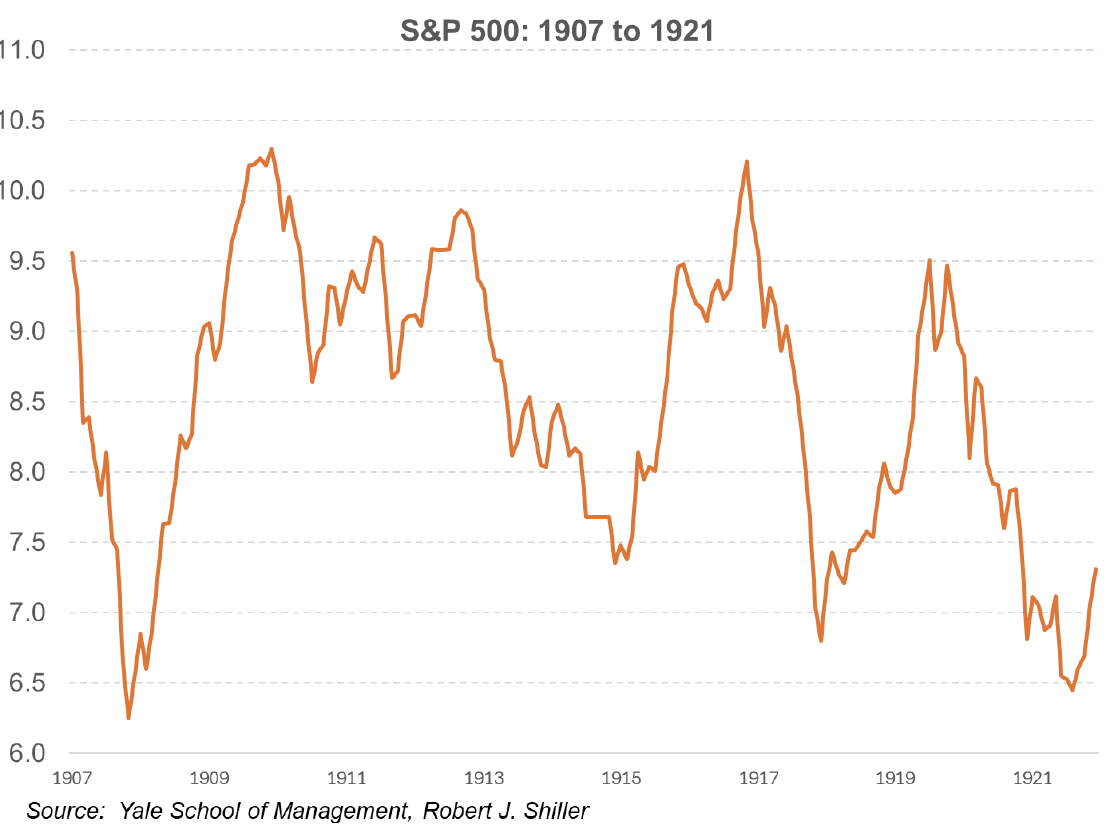
Back to the secular bear for the 15 year period from 1907 to 1921. This period included World War I and the Depression of 1920-21, the latter of which taught us that the way to end an economic depression quickly is to withdraw liquidity and let the system cleanse itself more quickly – fast track your way to the bottom. We and the Hoover administration learned such an approach may not actually work so well after all a decade later.
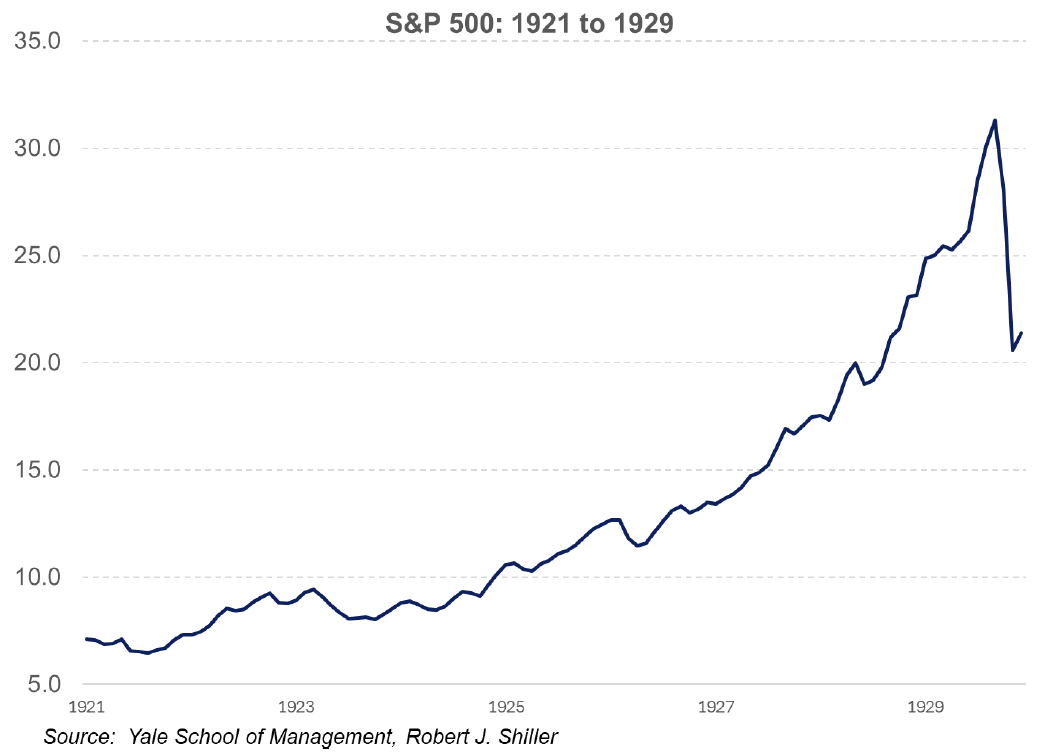
Shifting back to the Secular Bull Market phase, the Roaring Twenties from 1921 to 1929 as shown in the chart below are still well known a century later including the painful demise at the end.
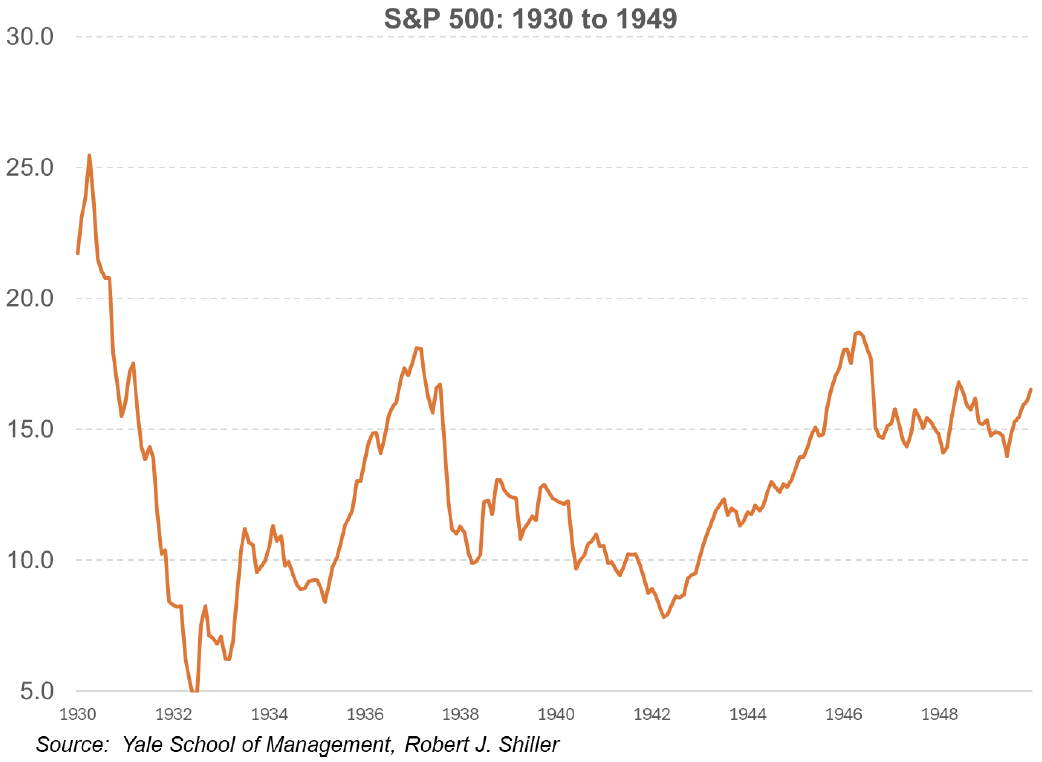
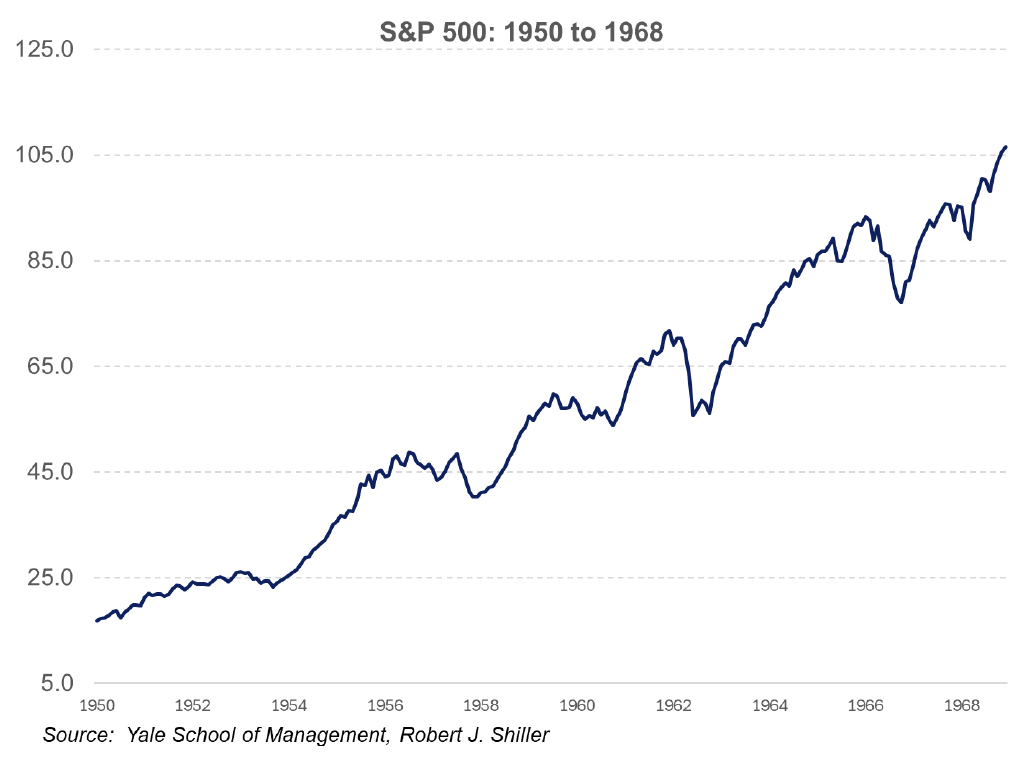
Once the U.S. economy emerged from the Great Depression and World War II, the economic boom of the 1950s and 1960s fueled a Secular Bull Market run for the next 19 years.
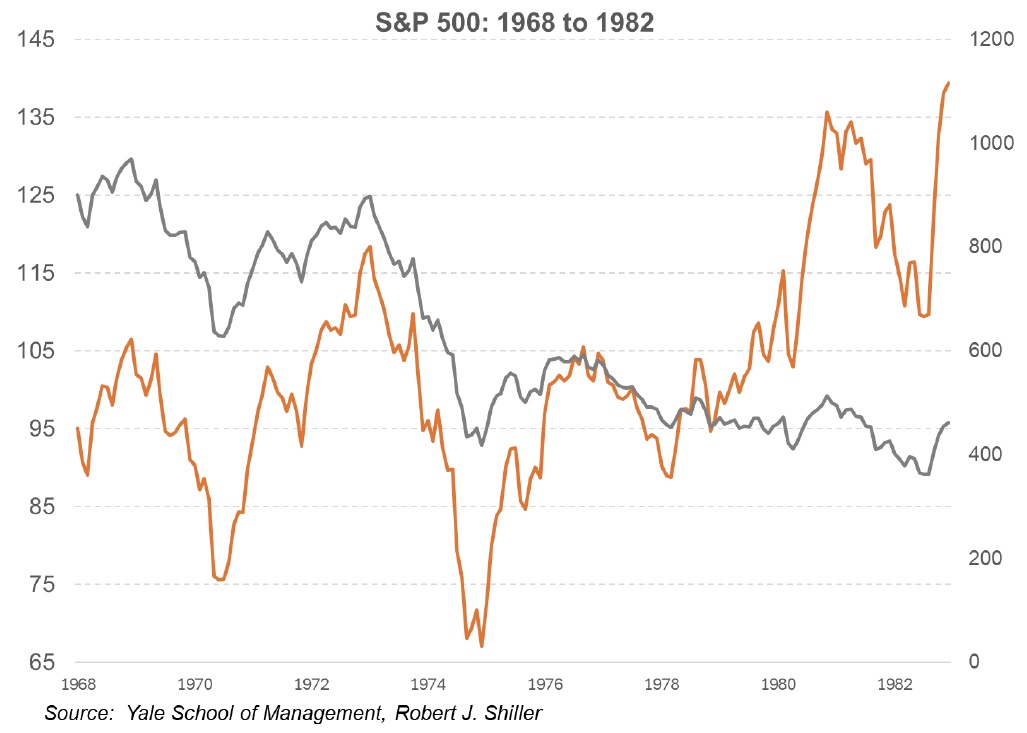
Of course, the seemingly endless post war economic boom ground to a halt starting in the late 1960s due to a series of economic recessions coupled with the outbreak of sustained inflation resulting in the toxic brew of “stagflation” that lasted through the 1970s and into the early 1980s. While the orange line in the chart below suggests that the stock market performed reasonably well during this time period, when viewed through an inflation adjusted lense as shown by the gray line, we see why BusinessWeek magazine slapped the now epically contrarian bottom signal “The Death of Equities” on its 1979 cover (it’s often overlooked that the final bottom did not come until nearly three years later after this cover hit the newsstands).
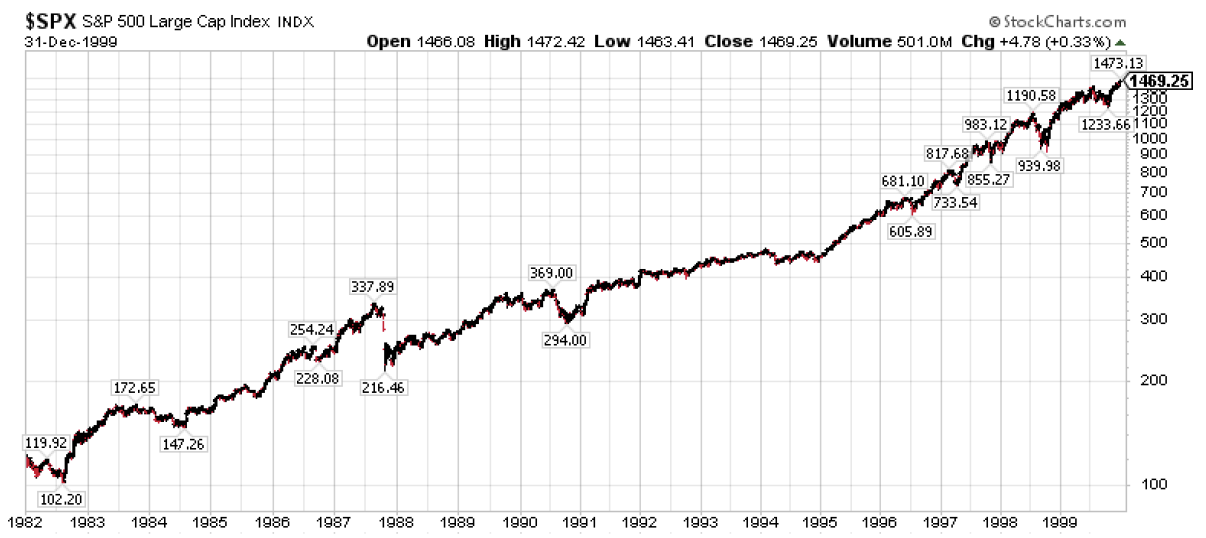
We finish, of course, with the legendary economic and stock market period from 1982 to 1999 that included the longest sustained economic expansion in U.S. history at the time and culminated with the massive equity bubble to close out the millennium. Talk about accumulated excesses needing to be worked off.
Already standing on the ground. All of this brings us back to today. We are currently in the tenth major secular market phase dating back over the past 150 years. This current phase is now running at 16 years and counting. And when we reflect back on the nine previous phases, while some have been longer and others shorter, they typically last around 17 years on average. What this suggests that we are likely already in the late innings if not in overtime in the current Secular Bull Market phase.
More importantly, we have no shortage of accumulated excesses that exist today to support the notion that the onset of the next Secular Bear Market phase may be long overdue at this point. Not only are stock valuations trading beyond historical highs on both a one-year trailing P/E and ten-year cyclically adjusted P/E (CAPE) basis, but some other key indicators are also flashing signs of worrisome froth.
Consider the market cap-to-GDP ratio, which historically averages around 100% and signals bubble territory for stocks when it is excess of 120%. Where is this reading today? Above 210%. Yikes!
Or consider the U.S. government gross debt-to-GDP ratio that has historically averaged 66% since World War II and where 90% is considered the upper limit before economic growth may become meaningfully impaired. Where are we today in the U.S.? North of 124%. Gulp.
The last one that I’ll mention ties to the extreme concentration we see in the U.S. stock marketplace today. Historically, when a single sector in the U.S. stock market made up more than 20% of the entire market cap of the S&P 500, it signaled excesses that would ultimately end badly and require an extended period of working off that would last years. More recent examples include the energy sector in the early 1980s, technology at the turn of the millennium, and financials in the mid-2000s. We know how all three of these past episodes ended. Where are we today? Tech makes up more than 34% of the total market cap of the S&P 500, and this doesn’t include the 7% that was sent out of tech and into communication services (Alphabet and Meta) and the 2% that was shifted to financials (Visa and MasterCard). Click all of this together and we’re well above double the historical 20% threshold at 43% to tech. What in the name of dot.com bubble could possibly go wrong?
Next, it was also considered a problematic signal when a single company made up more than 6% of the S&P 500. The past three examples in the past fifty years were AT&T in the mid-1970s, Exxon in the early 1980s, and IBM in the mid-1980s all notched this distinction, and subsequent performance for all three stocks were less than stellar in the decades since. Where do we stand today? We have three stocks on the S&P 500 all right now that percentages of the S&P 500 in excess of 6% including NVIDIA at more than 8%, Microsoft at more than 7%, and Apple at 6%. Repeat for emphasis, only three stocks in the last fifty years combined versus three stocks all at once today. Check it – if an investor takes $1 million and puts it into the S&P 500 thinking that they are getting broad stock diversification, turns out they are taking nearly a quarter of their money, or $210,000, and allocating it to just three stocks that are all in the same sector. Hmmm.
Bottom line. The fundamental economic and corporate earnings backdrop for the U.S. stock market is undoubtedly awesome. And there is seemingly no end in sight for U.S. stocks as they continue their ascent to fresh new all-time highs and potentially 7000 on the S&P 500 before the year is out. Nonetheless, we simply cannot ignore the rhythm of historical secular market phases and the fact that we may now be in the very late stages of a secular bull market dating back more than 16 years with accumulated excesses all around us. A secular bear market period where the cleansing of excesses will eventually take place, and we are at no shortage of excesses today that are currently well beyond their historical norms.
Thus, remain bullish and constructive on the near-term market environment, but do not lose sight of the building long-term bearish challenges that lie ahead over the next decade. More importantly, remember that secular bear markets are historically the best periods for active management and financial advisory growth through new client acquisition and greater value proposition breadth.
Disclosure: I/we have no stock, option or similar derivative position in any of the companies mentioned, and no plans to initiate any such positions within the next 72 hours. I wrote this article myself, and it expresses my own opinions. I am not receiving compensation for it. I have no business relationship with any company whose stock is mentioned in this article.
Investment advice offered through Great Valley Advisor Group (GVA), a Registered Investment Advisor. I am solely an investment advisor representative of Great Valley Advisor Group, and not affiliated with LPL Financial. Any opinions or views expressed by me are not those of LPL Financial. This is not intended to be used as tax or legal advice. All performance referenced is historical and is no guarantee of future results. All indices are unmanaged and may not be invested into directly. Please consult a tax or legal professional for specific information and advice.
LPL Compliance Tracking #: 785805
